Graphviz: Graph Visualization Software
This article introduces the usage of Graphviz.
What’s Graphviz?
Graphviz is open source graph visualization software. Graph visualization is a way of representing structural information as diagrams of abstract graphs and networks. It has important applications in networking, bioinformatics, software engineering, database and web design, machine learning, and in visual interfaces for other technical domains.
Install Graphviz
Under Linux environment, execute the following command to install Graphviz and show detail information of it:
chenwx@chenwx ~ $ sudo apt install graphviz
...

chenwx@chenwx ~ $ apt show graphviz
Package: graphviz
State: installed
Automatically installed: no
Multi-Arch: foreign
Version: 2.36.0-0ubuntu3.1
Priority: optional
Section: graphics
Maintainer: Ubuntu Developers <ubuntu-devel-discuss@lists.ubuntu.com>
Architecture: amd64
Uncompressed Size: 1828 k
Depends: libc6 (>= 2.15), libcdt5, libcgraph6, libexpat1 (>= 2.0.1), libgd3 (>=
         2.1.0~alpha~), libgvc6, libgvpr2, libx11-6, libxaw7, libxmu6, libxt6
Recommends: fonts-liberation
Suggests: gsfonts, graphviz-doc
Conflicts: gdtclft, gdtclft, graphviz
Provides: graphviz
Provided by: graphviz
...
Layout Commands
The following layout commands are available when Graphviz is installed:
| Commands | Description |
|---|---|
dot |
hierarchical or layered drawings of directed graphs. This is the default tool to use if edges have directionality. |
neato |
spring model layouts. This is the default tool to use if the graph is not too large (about 100 nodes) and you don’t know anything else about it. Neato attempts to minimize a global energy function, which is equivalent to statistical multi-dimensional scaling. |
fdp |
spring model layouts similar to those of neato, but does this by reducing forces rather than working with energy. |
sfdp |
multiscale version of fdp for the layout of large graphs. |
twopi |
radial layouts, after Graham Wills 97. Nodes are placed on concentric circles depending their distance from a given root node. |
circo |
circular layout, after Six and Tollis 99, Kauffman and Wiese 02. This is suitable for certain diagrams of multiple cyclic structures, such as certain telecommunications networks. |
chenwx@chenwx ~ $ for i in dot neato fdp sfdp twopi circo; do $i -V; done
dot - graphviz version 2.36.0 (20140111.2315)
neato - graphviz version 2.36.0 (20140111.2315)
fdp - graphviz version 2.36.0 (20140111.2315)
sfdp - graphviz version 2.36.0 (20140111.2315)
twopi - graphviz version 2.36.0 (20140111.2315)
circo - graphviz version 2.36.0 (20140111.2315)
Editor
The editor vimdot is included in Graphviz:
chenwx@chenwx ~ $ which vimdot
/usr/bin/vimdot
The Graphviz dot mode for emacs is also a useful tool for edit Graphvize.
Command-line Syntax
All Graphviz programs have a similar invocation:
cmd [ flags ] [ input files ]
If no input files are supplied, the program reads from stdin.
Flags
-
-Gname[=value]
Set a graph attribute, with default value
= true. -
-Nname[=value]
Set a default node attribute, with default value
= true. -
-Ename[=value]
Set a default edge attribute, with default value
= true. -
-Klayout
Specifies which default layout algorithm to use, overriding the default from the command name. For example, running
dot -Kneatois equivalent to running neato. -
-Tformat[:renderer[:formatter]]
Set output language to one of the supported formats. By default, attributed dot is produced.
Depending on how Graphviz was built, there may be multiple renderers for generating a particular output format, and multiple formatters for creating the final output. For example, a typical installation can produce PNG output using either the Cairo or GD library. The desired rendering engine can be specified after a colon. If there are multiple formatting engines available, the desired one can be specified in a similar fashion after the rendering engine. Thus,
-Tpng:cairospecifies PNG output produced by Cairo (using the Cairo’s default formatter), and-Tpng:cairo:gdspecifies PNG output produced by Cairo formatted using the GD library.If no renderer is specified, or a renderer but no formatter, the default one is invoked. The flag
-Tformat:produces a list of all of the renderers available for the specified format, the first one listed with a prefix matching format being the default. Using the-vflag will print which format, renderer, and formatter are actually used. -
-llibrary
User-supplied, device-dependent library text. Multiple flags may be given. These strings are passed to the code generator at the beginning of output.
For PostScript output, they are treated as file names whose content will be included in the preamble after the standard preamble. If library is the empty string
"", the standard preamble is not emitted. -
-n[num]
Sets no-op flag in neato. If set, neato assumes nodes have already been positioned and all nodes have a pos attribute giving the positions. It then performs an optional adjustment to remove node-node overlap, depending on the value of the overlap attribute, computes the edge layouts, depending on the value of the splines attribute, and emits the graph in the appropriate format. If num is supplied, the following actions occur:
-
num = 1
Equivalent to -n.
-
num > 1
Use node positions as specified, with no adjustment to remove node-node overlaps, and use any edge layouts already specified by the pos attribute. neato computes an edge layout for any edge that does not have a pos attribute. As usual, edge layout is guided by the splines attribute.
-
-
-ooutfile
Write output to file outfile. By default, output goes to stdout.
-
-O
Automatically generate output file names based on the input file name and the various output formats specified by the
-Tflags. -
-P
Automatically generate a graph that shows the plugin configuration of the current executable. e.g.
dot -P -Tps | lpr -
-q
Suppress warning messages.
-
-s[scale]
Set input scale to scale. If this value is omitted, 72.0 is used. This number is used to convert the point coordinate units used in the pos attribute into inches, which is what is expected by neato and fdp. Thus, feeding the output of a graph laid out by one program into neato or fdp almost always requires this flag. Ignored if the
-nflag is used. -
-V
Emit version information and exit.
-
-v
Verbose mode
-
-x
In neato, on input, prune isolated nodes and peninsulas. This removes uninteresting graph structure and produces a less cluttered drawing.
-
-y
By default, the coordinate system used in generic output formats, such as attributed dot, extended dot, plain and plain-ext, is the standard cartesian system with the origin in the lower left corner, and with increasing y coordinates as points move from bottom to top. If the
-yflag is used, the coordinate system is inverted, so that increasing values of y correspond to movement from top to bottom. -
-?
Print usage information, then exit.
If multiple -T flags are given, drawings of the graph are emitted in each of the specified formats. Multiple -o flags can be used to specify the output file for each format. If there are more formats than files, the remaining formats are written to stdout.
Note that the -G, -N and -E flags override any initial attribute declarations in the input graph, i.e., those attribute statements appearing before any node, edge or subgraph definitions. In addition, these flags cause the related attributes to be permanently attached to the graph. Thus, if attributed dot is used for output, the graph will have these attributes.
Environment Variables
-
GDFONTPATH
List of pathnames giving directories which a program should search for fonts. Overridden by DOTFONTPATH. Used only if Graphviz is not built with the fontconfig library.
-
DOTFONTPATH
List of pathnames giving directories which a program should search for fonts. Overridden by fontpath. Used only if Graphviz is not built with the fontconfig library.
-
SERVER_NAME
If defined, this indicates that the software is running as a web application, which restricts access to image files. See GV_FILE_PATH.
-
GV_FILE_PATH
If SERVER_NAME is defined, image files are restricted to exist in one of the directories specified by GV_FILE_PATH. This last is a list of directory pathnames, separated by semicolons in Windows or by colons otherwise. Note that sometimes, when using one of the layout programs in a web script, it is not enough to use an export command but rather the variables should be set when the command is run, for example:
SERVER_NAME=xxx GV_FILE_PATH="images:etc/images:/usr/share/images" dot -Tpng -o x.png x.gvNote that the image files must really reside in one of the specified directories. If the image file is specified as an absolute or relative pathname, a warning is given and only the base name is used.
-
GVBINDIR
Indicates which directory contains the Graphviz config file and plug-in libraries. If it is defined, the value overrides any other mechanism for finding this directory. If Graphviz is properly installed, it should not be needed, though it can be useful for relocation on platforms not running Linux or Windows.
DOT Language
The DOT Language is a plain text graph description language. It is a simple way of describing graphs that both humans and computer programs can use. DOT graphs are typically files that end with the .gv (or .dot) extension. The .gv extension is preferred in cases where there could be confusion with the .dot file extension used by early (pre-2007) versions of Microsoft Word.
     graph : [ strict ] (graph | digraph) [ ID ] '{' stmt_list '}'
 stmt_list : [ stmt [ ';' ] stmt_list ]
      stmt : node_stmt | edge_stmt | attr_stmt | ID '=' ID | subgraph

 attr_stmt : (graph | node | edge) attr_list
 attr_list : '[' [ a_list ] ']' [ attr_list ]
    a_list : ID '=' ID [ (';' | ',') ] [ a_list ]

 edge_stmt : (node_id | subgraph) edgeRHS [ attr_list ]
   edgeRHS : edgeop (node_id | subgraph) [ edgeRHS ]

 node_stmt : node_id [ attr_list ]
   node_id : ID [ port ]
      port : ':' ID [ ':' compass_pt ] | ':' compass_pt
compass_pt : (n | ne | e | se | s | sw | w | nw | c | _)

  subgraph : [ subgraph [ ID ] ] '{' stmt_list '}'
The keywords node, edge, graph, digraph, subgraph, and strict are case-independent. Note also that the allowed compass point values are not keywords, so these strings can be used elsewhere as ordinary identifiers and, conversely, the parser will actually accept any identifier.
An ID is one of the following:
- Any string of alphabetic (
[a-zA-Z\200-\377]) characters, underscores (_) or digits ([0-9]), not beginning with a digit; - a numeral
[-]?(.[0-9]+ | [0-9]+(.[0-9]*)?); - any double-quoted string (
"...") possibly containing escaped quotes ('); - an HTML string (
<...>).
An ID is just a string; the lack of quote characters in the first two forms is just for simplicity. There is no semantic difference between abc_2 and "abc_2", or between 2.34 and "2.34". Obviously, to use a keyword as an ID, it must be quoted. Note that, in HTML strings, angle brackets must occur in matched pairs, and newlines and other formatting whitespace characters are allowed. In addition, the content must be legal XML, so that the special XML escape sequences for ", &, <, and > may be necessary in order to embed these characters in attribute values or raw text. As an ID, an HTML string can be any legal XML string. However, if used as a label attribute, it is interpreted specially and must follow the syntax for HTML-like labels.
Both quoted strings and HTML strings are scanned as a unit, so any embedded comments will be treated as part of the strings.
An edgeop is -> in directed graphs and -- in undirected graphs.
The language supports C++-style comments: /* */ and //. In addition, a line beginning with a '#' character is considered a line output from a C preprocessor (e.g., # 34 to indicate line 34 ) and discarded.
Semicolons and commas aid readability but are not required. Also, any amount of whitespace may be inserted between terminals.
As another aid for readability, dot allows double-quoted strings to span multiple physical lines using the standard C convention of a backslash immediately preceding a newline character2. In addition, double-quoted strings can be concatenated using a ‘+’ operator. As HTML strings can contain newline characters, which are used solely for formatting, the language does not allow escaped newlines or concatenation operators to be used within them.
Digraph or Graph
A graph must be specified as either a digraph (有向图) or a graph (无向图). Semantically, this indicates whether or not there is a natural direction from one of the edge’s nodes to the other. Lexically, a digraph must specify an edge using the edge operator -> while a undirected graph must use --. Operationally, the distinction is used to define different default rendering attributes. For example, edges in a digraph will be drawn, by default, with an arrowhead pointing to the head node. For ordinary graphs, edges are drawn without any arrowheads by default.
The attributes can be found on Node, Edge and Graph Attributes.
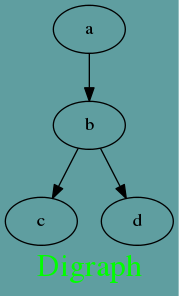
Digraph
Save the following script to test_digraph.gv:
digraph test_digraph
{
    graph[bgcolor="cadetblue" label="Digraph" fontsize=24 fontcolor="green"];

    a -> b -> c
    b -> d
}
Then, run the following command to create test_digraph.gv.png:
chenwx@chenwx ~ $ dot -Tpng -O test_digraph.gv
Graph
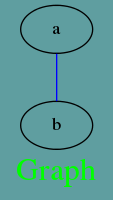
A graph may also be described as strict. This forbids the creation of multi-edges, i.e., there can be at most one edge with a given tail node and head node in the directed case. For undirected graphs, there can be at most one edge connected to the same two nodes. Subsequent edge statements using the same two nodes will identify the edge with the previously defined one and apply any attributes given in the edge statement. For example, the following graph will have a single edge connecting nodes a and b, whose color is blue.
Save the following script to test_digraph.gv:
strict graph test_graph
{
    graph[bgcolor="cadetblue" label="Graph" fontsize=24 fontcolor="green"];

    a -- b
    a -- b
    b -- a [color=blue]
}
Then, run the following command to create test_graph.gv.png:
chenwx@chenwx ~ $ dot -Tpng -O test_graph.gv
Node
There are three main types of shapes: polygon-based, record-based and user-defined. The record-based shape has largely been superseded and greatly generalized by HTML-like labels. That is, instead of using shape=record, one might consider using shape=none, margin=0 and an HTML-like label.
The geometry and style of all node shapes are affected by the node attributes fixedsize, fontname, fontsize, height, label, style and width.
Polygon-based Nodes
Save the following script to test_polygon.gv:
digraph test_polygon_based_node
{
    node1 [shape=ellipse, label="Ellipse\nNode"];
    node2 [shape=parallelogram, label="Parallelogram\nNode", color="green"];
    node3 [shape=circle, label="Circle\nNode", style=filled, fillcolor="yellow"];

    node1 -> node2 -> node3
}
Then, run the following command to create test_polygon.gv.png:
chenwx@chenwx ~ $ dot -Tpng -O test_polygon.gv
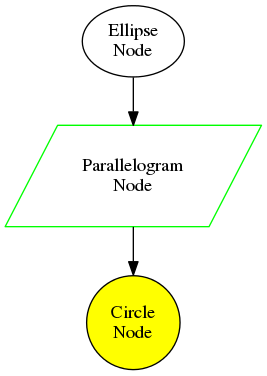
The polygon-based nodes can be found on Polygon-based Nodes. The attributes can be found on Node, Edge and Graph Attributes.
Record-based Nodes
Save the following script to test_record.gv:
digraph test_record_based_node
{
node [shape=record];
struct1 [label="<f0> left|<f1> mid\ dle|<f2> right"];
struct2 [label="<f0> one|<f1> two"];
struct3 [label="hello\nworld |{ b |{c|<here> d|e}| f}| g | h"];
struct1:f1 -> struct2:f0;
struct1:f2 -> struct3:here;
}
Then, run the following command to create test_record.gv.png:
chenwx@chenwx ~ $ dot -Tpng -O test_record.gv
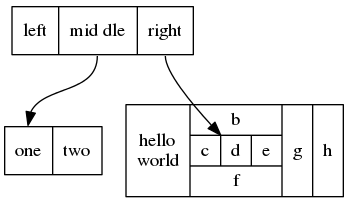
The record-based nodes can be found on Record-based Nodes. The attributes can be found on Node, Edge and Graph Attributes.
User-defined Nodes
The user-defined nodes can be found on User-defined Nodes. The attributes can be found on Node, Edge and Graph Attributes.
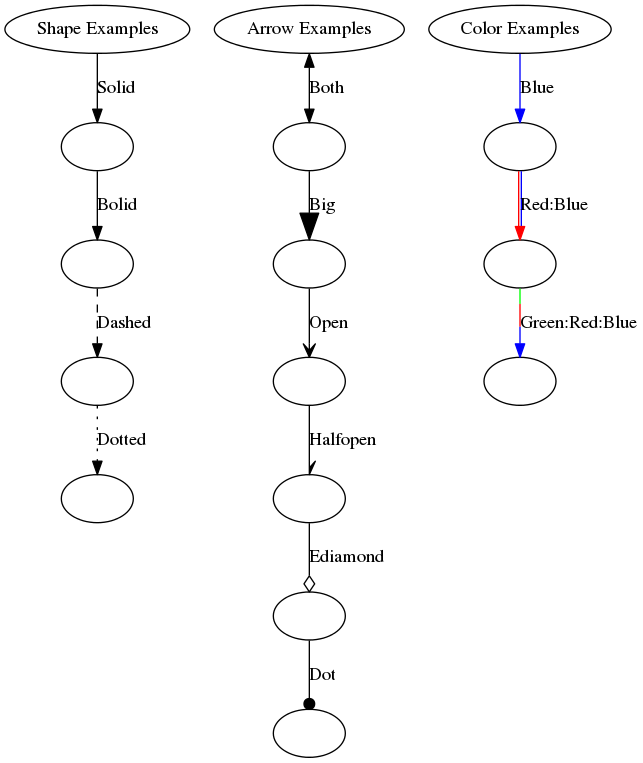
Edge
Save the following script to test_edge.gv:
digraph test_edge
{
    style0[label="Shape Examples"];
    style1[label=""] style2[label=""] style3[label=""] style4[label=""];

    style0 -> style1 [style=solid, label="Solid"];
    style1 -> style2 [style=solid, label="Bolid"];
    style2 -> style3 [style=dashed, label="Dashed"];
    style3 -> style4 [style=dotted, label="Dotted"];

    arrow0[label="Arrow Examples"];
    arrow1[label=""] arrow2[label=""] arrow3[label=""] arrow4[label=""] arrow5[label=""] arrow6[label=""];
    arrow0 -> arrow1 [dir=both, label="Both"];
    arrow1 -> arrow2 [arrowsize=2.0, label="Big"];
    arrow2 -> arrow3 [arrowhead="open", label="Open"];
    arrow3 -> arrow4 [arrowhead="halfopen", label="Halfopen"];
    arrow4 -> arrow5 [arrowhead="ediamond", label="Ediamond"];
    arrow5 -> arrow6 [arrowhead="dot", label="Dot"];

    color0[label="Color Examples"];
    color1[label=""] color2[label=""] color3[label=""];
    color0 -> color1 [color="blue", label="Blue"];
    color1 -> color2 [color="red:blue", label="Red:Blue"];
    color2 -> color3 [color="green:red;0.4:blue", label="Green:Red:Blue"];
}
Then, run the following command to create test_edge.gv.png:
chenwx@chenwx ~ $ dot -Tpng -O test_edge.gv
The attributes can be found on Node, Edge and Graph Attributes.
References
- Graphviz Offical Site
- Graphviz on GitHub
- Graphviz on-line Documentation
- Quick Reference Guide for GraphViz
- Drawing graphs with dot
- 开源项目: 自动绘图工具Graphviz
- Node, Edge and Graph Attributes